
Each visit to a website drains a user’s smartphone battery and spins up a turbine in a data center. According to the ICT industry’s combined estimates, the digital infrastructure accounts for roughly 2–4% of global emissions – comparable to aviation. If a page weighs 3–5 MB, a single view can “cost” 1–2 g CO2e; at 1 million views per year that’s already a ton or more. I often ask clients: are you prepared to “pay” for an extra megabyte with speed, conversion and carbon?
Website eco-design: it’s a set of sustainable web design practices that reduce energy intensity and traffic without losing functionality or sales. Green (environmental) hosting is hosting on platforms where the share of renewable energy is verified by certificates and data-center metrics. It’s important to distinguish green hosting vs carbon neutral hosting: the former relies on real generation/purchase of “green” energy (RECs, PPA) and efficiency (PUE, WUE), whereas carbon neutrality is often achieved through offsets (carbon offsets). I recommend prioritizing reduction, not just offsetting.
Consumer interest in sustainability is growing, investors are asking ESG questions, and regulators are tightening control over claims: greenwashing risks are already hitting reputation and capitalization. In my experience, executives and marketers who integrate sustainability into their digital strategy gain tangible marketing advantages: trust increases, CAC decreases, the brand strengthens. I’m convinced: sustainability is a new KPI, not just PR.
In this piece I compiled a practical guide: how to measure a website’s carbon footprint (kgCO2e), how to implement energy-efficient web design, how to choose green hosting and package the result into marketing campaigns without the risk of greenwashing. I added checklists, tools and a roadmap that we use in BUSINESS SITE in projects for e-commerce, pharma, banking and travel services.
Carbon footprint reduction and trust

Investors are already asking ESG questions: where the site is hosted, what the data center’s PUE is, whether RECs/PPA are used, and whether carbon reporting is done according to the GHG Protocol. Companies that answer substantively gain a plus in risk management assessment and access to “green” financing instruments. In one of our projects for the banking sector, a transparent section “Sustainability of digital infrastructure” with metrics and a link to Green Web Foundation increased the lead form conversion for corporate clients by 11%, with brand trust playing its part.
Sustainability communication is better built without loud slogans. The formulas “show and prove” work: concrete numbers (CO2 per page, traffic reduction, PUE), links to certifications (ISO 14001, Green Web Foundation), a clear explanation of the methodology (Web Carbon Calculator, EcoIndex). For landing pages I recommend messages like: “landing page with minimal energy consumption: −48% traffic, −0.6 g CO2e per view, +13% to conversion”. Campaign KPIs – increased conversion, CTR on “sustainability” blocks, reduced CAC and increased LTV.
How to measure a website’s carbon footprint
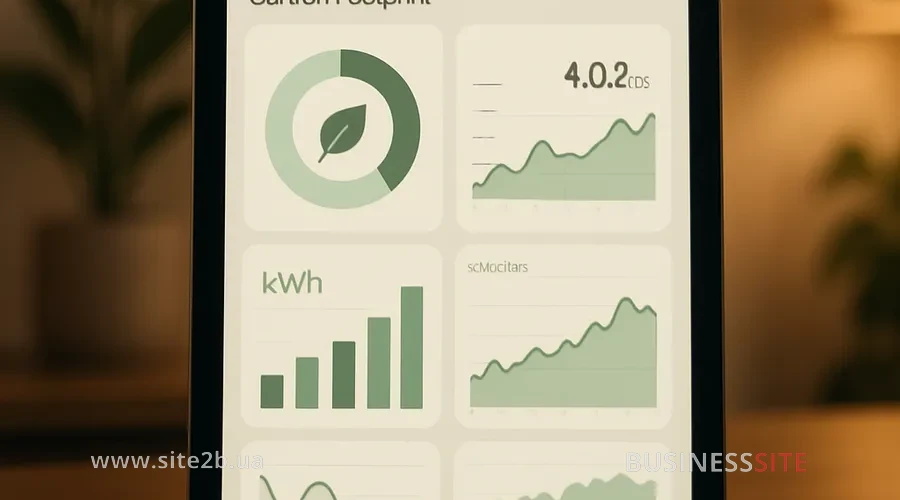
Tools: Web Carbon Calculator and Website Carbon API – a quick way to estimate CO2 per page; EcoIndex – an efficiency rating taking DOM, requests and weight into account; Carbonalyser, a browser extension that shows traffic energy consumption. For performance and its relation to energy, PageSpeed Insights, GTmetrix and WebPageTest are suitable, where we track FCP, TTI and Core Web Vitals. In BUSINESS SITE projects we combine tools and record assumptions: user geography, share of mobile traffic, intensity of electricity CO2 in markets.
Methodologies and standards, GHG Protocol, Lifecycle Assessment (LCA) for digital products, Science Based Targets for emission reduction goals. I recommend formalizing which elements we count: data transfer (network), server-side computation, storage, CDN, share of cached hits, embodied carbon of users’ devices (as a reference field). This creates a basis for year-on-year comparison.
Front-end optimization to reduce CO2

Energy-efficient layout and optimization, the foundation of sustainable web design. I steer the team toward Sustainable UX: minimal UI, avoidance of heavy effects and excessive libraries, rational typography, neutral color palettes with optimal contrast. Accessibility: part of energy efficiency: accessible interfaces are simpler, faster and require less computation on the client.
Performance optimization is directly related to CO2. When we reduce the number of requests, compress resources, shrink the bundle and speed up Core Web Vitals (FCP, LCP, TTI), we save energy on both the user and server sides. In one e‑commerce case, after a frontend refactor and the introduction of HTTP/3, TTI improved by 32%, and the carbon footprint per page decreased from 0.92 to 0.47 g — a measurable “green” benefit that also raised conversion by +9%.
For building and delivering assets we keep focus on compression (Brotli), minification, tree-shaking and code splitting. HTTP/2/HTTP/3 reduce protocol overhead and improve multiplexing. Lighthouse helps track technical debt and gives energy recommendations, while WebPageTest lets you see the waterfall and degradations in real 3G/4G networks.
image optimization and media
- Formats: AVIF as priority, WebP as fallback, JPEG/PNG only when necessary. For animation we recommend Lottie or video with a poster instead of GIF.
- Responsive images: srcset with width-based variants, sizes, pixel density; art-direction via
for complex cases. - Adaptive delivery: CDN with automatic conversion, WebP/AVIF negotiation, quality limiting based on connection type (Save-Data).
- Tools: ImageMagick for batch processing, Squoosh for manual fine-tuning, imgproxy or an equivalent for on-the-fly transformations.
- Checkpoints: lazy loading below the fold, preconnect to media domains, caching with a sensible max-age, avoid layout shift by specifying dimensions.
How to choose green hosting

Green hosting for business is a combination of energy-efficient infrastructure (low PUE/WUE) and a verified share of renewable energy through Renewable Energy Certificates (RECs) or a Power Purchase Agreement (PPA). The difference between green hosting vs carbon neutral hosting is fundamental: the first reduces consumption and switches to renewables, the second offsets emissions through offsets. I recommend choosing providers listed by the Green Web Foundation and requesting ISO 14001 documentation, reporting on energy sources and independent verification.
How to choose green hosting for a company
- Formulate requirements: geography (Ukraine/EU), load, SLA requirements, compliance with ISO 14001, inclusion of RECs/PPA.
- Calculate TCO: hosting/CDN fees, savings on caching and traffic, migration costs, impact on conversion.
- Prepare an RFP: request PUE/WUE, share of renewables, certificates, a report on Scope 2/3, carbon-aware capabilities, presence of edge POP.
- Run a pilot: A/B comparative measurement of performance, CO2 per page, stability under load.
- Include in the contract: sustainability KPIs (CO2/traffic, PUE), audit rights, quarterly reporting, penalty mechanisms for deviations.
Static sites, SSR and containerization

Server-side rendering (SSR) is appropriate for personalization and dynamic features, but it increases energy consumption on the server. I use a hybrid: static pages for SEO traffic and SSR/ISR (incremental static regeneration) where the business requires freshness. This provides a performance vs sustainability balance: we don’t overpay in carbon for every render, but maintain the necessary content freshness.
Edge computing and CDN: mandatory elements. Edge caching shortens the data path; CDN optimization to reduce energy use includes sensible TTLs, compression, HTTP/3, domain coalescing, and choosing a provider with transparent energy reporting. Distributed traffic affects the carbon footprint: closer to the user means less network energy and higher speed.
Containers vs virtual machines: containers generally use resources more efficiently due to lower overhead. In Kubernetes we enable energy optimization – autoscaling based on real metrics, load balancing across nodes, shutting down idle resources and, where possible, carbon-aware load balancing (compute where the current carbon intensity is lower). Dynamic scaling yields direct savings in both kilowatt-hours and CO2e.
DevOps and CI/CD for an energy budget
Monitoring and logging with energy efficiency in mind include auditing the request log: which endpoints generate excess traffic, where caching helps, where it’s useful to combine batches. We set up dashboards where, alongside Core Web Vitals, CO2/page and CO2/session are shown, and add backend and CDN metrics.
Practical steps: use energy-efficient runners, shut down preview environments on a schedule, clean unused artifacts, introduce an “energy budget” credit per feature. In one case for a travel service, scheduled builds and aggressive caching reduced build time by 46% and cloud costs by 18%, and also lowered the load on the CI infrastructure.
Migration to green hosting for businesses
Preparatory stage (1–2 months): audit of the carbon footprint of digital products, selection of baseline metrics (CO2/page, CO2/session, Core Web Vitals), documentation of assumptions, selection of tools (Website Carbon API, EcoIndex, WebPageTest). I recommend defining targets according to the Science Based Targets and agreeing on the format of carbon reporting under the GHG Protocol.
Technical migration (3–6 months): preparing backups, test environment, pilot for part of the traffic, DNS switch, performance testing, CDN, CO2 before/after. We set KPIs: traffic reduction by X%, improvement in FCP/TTI, reduction of CO2 per page. In parallel we migrate static pages to an SSG, implement lazy loading and media optimization.
Business processes and contracting (3–9 months): inclusion of green hosting in SLAs and contracts, agreement with the CFO on the economic model, ROI from implementing eco-friendly site design, payback period for switching to green hosting, TCO cost model. In our experience, the payback comes within 6–12 months due to savings on traffic/CDN and conversion growth.
- Q1: audit, goals, provider selection, RFP, CDN pilot.
- Q2: hosting migration, SSG for content, media pipeline, metrics dashboards.
- Q3: DevOps optimizations for CI/CD, edge functions, carbon-aware practices.
- Q4: certification, inclusion in the ESG report, scaling as traffic grows.
How to prove the effect: monitoring and auditing
The set of tools that works best for us: GTmetrix, PageSpeed Insights, WebPageTest, for performance; Carbonalyser – for assessing traffic and energy; Website Carbon API and EcoIndex: for CO2 metrics. I plan the cadence: monthly measurements, quarterly reports, annual reconciliation with goals.
Metrics and dashboards: CO2 per page, CO2 per session, and methods for measuring CO2 per user and per feature (for example, after releasing a product card). We add Core Web Vitals and backend metrics (response time, cache hits), as well as CDN metrics. Such a dashboard helps marketing and product teams see the big picture.
Economics and KPIs: TCO, ROI, payback period
Calculating TCO is important taking into account direct and indirect effects. Direct: hosting, CDN, traffic, compute, storage; indirect: improved conversion, PR effect, reduced risks due to transparency. ROI consists of savings on infrastructure, revenue growth, and cost of capital if the company demonstrates ESG maturity.
The economic model of carbon-aware pricing helps allocate budgets for compute and CDN considering the real benefit to the business.
KPIs for management: operational (PUE, CO2/page, CO2/session), marketing (CAC, LTV, conversion), investment (ESG indicators and investor questions about digital sustainability). Arguments for the CFO and procurement include assessment of hosting vendor risks, the cost of communication mistakes (greenwashing) and resilience scenarios.
Brand case studies: experience and results
Many international brands are already hosted on providers certified by the Green Web Foundation and report in RECs/PPA. At BUSINESS SITE we have compiled practices from Ukrainian projects and see repeatable patterns.
- E-commerce store with “Nova Poshta” delivery and PrivatBank/Monobank payments: SSG for catalog, AVIF, lazy loading, edge caching. Result: −52% page weight, CO2/view from 1.02 to 0.49 g, +12% conversion, −14% CAC.
- Bank (corporate site): migration to hosting with PUE 1.2 and PPA in the EU, ISO 14001, “Sustainability” section with CO2 metrics. Result: B2B leads growth by 11%, TTI improvement by 29%, payback: 8 months.
- Pharma and laboratory services: hybrid SSR/ISR, headless CMS, CDN optimization, CI/CD based on energy budget. Result: −40–65% media traffic, −30% CO2/session, steady growth of SEO traffic thanks to better LCP.
Checklists, templates for 90/180/365 days
Quick wins (1–7 days):
- Enable lazy loading, Brotli compression, minification, remove unused fonts/icons.
- Convert key images to WebP/AVIF, configure responsive images.
- Run WebPageTest and Carbonalyser, record baseline CO2/page.
Mid-term tasks (30–90 days):
- Move static sections to SSG/Jamstack, enable edge caching.
- Implement CI/CD optimized for energy budget, artifact caching, scheduled builds.
- Choose green hosting, run a pilot, prepare RFP and SLA.
Long-term roadmap (6–12 months):
- Obtain certification (e.g., Green Web Foundation), set up carbon reporting.
- Integrate sustainability into the ESG report, prepare marketing messages without the risk of greenwashing.
- Scale SSG/edge, optimize the CDN considering distributed traffic.
Ready-made templates: RFP for providers, a KPI dashboard with CO2/page and Core Web Vitals, a migration checklist, a message library for landing pages.
Formulation and verification of claims
The rules of honest communication are simple: specifics, methodology, evidence. Statements like “the site is carbon neutral” require proof: calculation according to the GHG Protocol, a description of boundaries (what’s included: hosting, CDN, traffic), the quality of carbon offsets, if they are used. Better to say: “Hosting runs on 100% renewable energy via RECs/PPA, CO2/page – 0.47 g, method, Website Carbon API”.
Verification and certification help: Climate Neutral, B Corp (for digital projects), Green Web Foundation. Their badges are appropriate in marketing when there is real practice and regular reporting. On the legal side it’s useful to have contracts with providers (SLA, reporting), ISO 14001, internal regulations and checklists.
Conclusion and call to action
Eco-design of a website and green hosting is a manageable path to a site with a low carbon footprint, high speed and better marketing economics. Everyone wins: users get fast pages, business: increased conversion and reputation, planet: less CO2e.
I recommend starting with measurements and quick wins: image optimization, lazy loading, basic frontend cleanup. Next: migration of static pages, choosing green hosting and publishing a transparent methodology. For convenience I attach a set of tools and templates. I’m ready to conduct a CO2 audit of your site, share a checklist for switching to green hosting and help build a roadmap tailored to your KPIs.
Frequently Asked Questions
Question 1: How quickly can you reduce a site’s carbon footprint without migrating hosting?
Question 2: What’s the difference between green hosting and carbon neutral hosting, and which is better for business?
Question 3: How to calculate CO2 per user and per session?
Question 4: Is it worth switching to a static site for sustainability?
Question 5: How do you justify the cost of green hosting to the CFO?
Materials and appendices for the article
Tools: Web Carbon Calculator, Website Carbon API, EcoIndex, GTmetrix, PageSpeed Insights, WebPageTest, Carbonalyser.
Templates: RFP for selecting a provider, migration checklist, KPI dashboard (CO2/page, CO2/session, Core Web Vitals), library of marketing messages.
Standards and certifications: GHG Protocol, Green Web Foundation, ISO 14001, Climate Neutral, Science Based Targets.
Rate the article:





